· Rajasekhar Gundala · Distributed Tracing · 7 min read
How to deploy Observability Stack using docker compose behind Caddy v2.6.4
Find or Identify operational issues or security breaches, before they become issues that impact customers or users.

Today I am going to deploy Observability Stack (Quickwit, Jaeger, OpenTelemetry, Loki, Grafana and Prometheus). It is very import to monitor the application logs, metrics and traces for smooth functioning.
This observability stack helps us to find the errors and fix them before the client catches them. in other words this stack is called as distributed tracing.
Distributed tracing is a method of tracking or identifying how the requests propagate from the front end (in our case Caddy Reverse Proxy) to backend services or databases.
Also distributed tracing or observability enables developers or devops to see how an individual request is handled by analyzing the gathered logs or by looking into the traces for their external id’s.
Monitor and troubleshoot requests in large distributed systems
Let’s start with actual deployment…
Prerequisites
We will be using the below open-source tools to build our Observability Stack or Distributed Tracing Application using Docker-Compose.
Ubuntu Server (any Linux flavor).
Docker and Docker-compose Installed on the server.
Caddy as reverse proxy to expose micro-services to external.
Quickwit, Opentelemetry, Jaeger, Loki, Grafana and Prometheus
If you want to learn more about each component in the Observability Stack, please find the below links.
Introduction
Observability is the ability to collect data about program’s execution, internal states of applications and the communication among individual components in a distributed environment. To improve observability, devops or systems engineers use wide range of logging and tracing techniques to gather telemetry data, tools to analyze and use it to improve performance.
Here I am using Quickwit as a storage backend for Jaeger, OpenTelemetry to collect the data (logs, metrics and traces) from docker containers (micro-services), Loki to collect logs from the docker containers using Flog, Grafana to create dashboards and Prometheus to monitor.
Why Observability is Important
As I mentioned earlier Observability or Distributed Tracing allows us to find or identify potential problems, such as operational issues or security breaches, before they become issues that impact customers or users.
Observability helps dev teams to understand how their systems or applications behave in production environment.
Prepare Environment
Most of the time I use /opt directory to place the configuration files like docker-compose.yml, prometheus.yml, otelconfig.yaml and data folders to save containers data for persistency.
Use the below commands to create the folder.
cd /opt
sudo mkdir -p caddy
cd caddy
sudo touch docker-compose.yml
Observability Stack Docker Compose
Open docker-compose.yml created earlier with nano editor using sudo nano docker-compose.yml
Copy and paste the below code in docker-compose.yml
Here is the docker compose file for Observability Stack
version: "3.7"

services:
  quickwit:
    image: quickwit/quickwit
    command: run
    container_name: quickwit
    restart: unless-stopped
    volumes:
      - ./quickwit-data:/quickwit/qwdata
    environment:
      - QW_ENABLE_OPENTELEMETRY_OTLP_EXPORTER=true
      - OTEL_EXPORTER_OTLP_ENDPOINT=http://quickwit:7281
      - QW_ENABLE_OTLP_ENDPOINT=true
      - QW_ENABLE_JAEGER_ENDPOINT=true
      - QW_DISABLE_TELEMETRY=1
    networks:
      - inet
    depends_on:
      caddy:
        condition: service_started
  jaeger:
    image: jaegertracing/jaeger-query:latest
    container_name: jaeger
    restart: unless-stopped
    environment:
      - SPAN_STORAGE_TYPE=grpc-plugin
      - GRPC_STORAGE_SERVER=quickwit:7281
      - COLLECTOR_ZIPKIN_HOST_PORT=:9411
      - COLLECTOR_OTLP_ENABLED=true
      - METRICS_STORAGE_TYPE=prometheus
      - PROMETHEUS_SERVER_URL=htts://prometheus:9090
      - PROMETHEUS_QUERY_SUPPORT_SPANMETRICS_CONNECTOR=true
    networks:
      - inet
    depends_on:
      caddy:
        condition: service_started
  otelcol:
    image: otel/opentelemetry-collector-contrib:latest
    container_name: otelcol
    restart: unless-stopped
    deploy:
      resources:
        limits:
          memory: 125M
    command: [--config=/etc/otelcol-config.yaml]
    volumes:
      - ./otelconfig.yaml:/etc/otelcol-config.yaml
    networks:
      - inet
    depends_on:
      caddy:
        condition: service_started
  loki:
    image: grafana/loki:latest
    container_name: loki
    restart: unless-stopped
    networks:
      - inet
    depends_on:
      caddy:
        condition: service_started
  flog:
    image: mingrammer/flog
    container_name: flog
    restart: unless-stopped
    command: -f json -d 1s -l
    networks:
      - inet
    depends_on:
      caddy:
        condition: service_started
  promtail:
    image: grafana/promtail:2.8.0
    container_name: promtail
    restart: unless-stopped
    volumes:
      - ./promtail-local-config.yaml:/etc/promtail/config.yaml:ro
    command: -config.file=/etc/promtail/config.yaml
    networks:
      - inet
    depends_on:
      caddy:
        condition: service_started
  grafana:
    image: grafana/grafana-oss:latest
    container_name: grafana
    restart: unless-stopped
    volumes:
      - ./grafana-data:/var/lib/grafana
    environment:
      - GF_SECURITY_ADMIN_USER=username
      - GF_SECURITY_ADMIN_PASSWORD=password
      - GF_SECURITY_ADMIN_EMAIL=user@example.com
      - GF_SECURITY_DISABLE_GRAVATAR=true
      - GF_SECURITY_DISABLE_BRUTE_FORCE_LOGIN_PROTECTION=true
      - GF_SECURITY_COOKIE_SECURE=TRUE
      - GF_SERVER_ENABLE_GZIP=true
      - GF_SERVER_ROOT_URL=https://grafana.example.com
      - GF_ANALYTICS_REPORTING_ENABLED=false
      - GF_USERS_ALLOW_SIGN_UP=false
      - GF_USERS_DEFAULT_THEME=light
      - GF_EXPLORE_ENABLED=true
      - GF_ALERTING_ENABLED=false
      - GF_UNIFIED_ALERTING_ENABLED=true
      - GF_FEATURE_TOGGLES_ENABLE=traceToMetrics,publicDashboards,tempoApmTable
    entrypoint:
      - sh
      - -euc
      - |
        mkdir -p /etc/grafana/provisioning/datasources
        cat <<EOF > /etc/grafana/provisioning/datasources/ds.yaml
        apiVersion: 1
        datasources:
          - name: Loki
            type: loki
            access: proxy
            url: http://loki:3100
        EOF
        /run.sh
    networks:
      - inet
    depends_on:
      loki:
        condition: service_started
  prometheus:
    image: prom/prometheus:latest
    container_name: prometheus
    restart: unless-stopped
    command:
      - --config.file=/etc/prometheus/prometheus.yml
      - --web.enable-remote-write-receiver
      - --enable-feature=exemplar-storage
    volumes:
      - ./prometheus.yml:/etc/prometheus/prometheus.yml
    networks:
      - inet
    depends_on:
      caddy:
        condition: service_started
  caddy:
    image: tuneit/caddy
    restart: unless-stopped
    container_name: caddy
    ports:
      - target: 80
        published: 80
        mode: host
      - target: 443
        published: 443
        mode: host
      - target: 443
        published: 443
        mode: host
        protocol: udp
      - target: 2019
        published: 2019
        mode: host
    networks:
      - caddy
      - inet
    volumes:
      - ./Caddyfile:/etc/caddy/Caddyfile
      - ./caddydata:/data
      - ./caddyconfig:/config
      - ./caddylogs:/var/log/caddy
    environment:
      - OTEL_SERVICE_NAME=caddy
      - OTEL_EXPORTER_OTLP_TRACES_ENDPOINT=http://quickwit:7281
volumes:
  caddydata:
  caddyconfig:
  caddylogs:
  grafana-data:
  quickwit-data:
networks:
  caddy:
    external: true
  inet:
    driver: bridge
Here I used a custom Caddy docker container with plugins, like Cloudflare DNS, Caddy Auth Portal etc…
Please find the custom caddy docker image below.
Here you can observe that I used one docker-compose file to deploy all the micro-services. One thing we can observe that I used depends_on to control start and shutdown dependencies between services.
I wanted to start the Caddy service first because it’s acts as a reverse proxy in my environment.
Caddyfile – Observability Stack
The Caddyfile is a convenient Caddy configuration format for humans.
Caddyfile is easy to write, easy to understand, and expressive enough for most use cases.
Please find Production-ready Caddyfile for the `Observability Stack`
Learn more about Caddyfile here to get familiar with it.
{
    email user@example.com
    default_sni anything
    cert_issuer acme
    # Production acme directory
    acme_ca https://acme-v02.api.letsencrypt.org/directory
    servers {
        metrics
        protocols h1 h2c h3
        strict_sni_host on
        trusted_proxies cloudflare {
            interval 12h
            timeout 15s
        }
    }
    admin 0.0.0.0:2019
}

prometheus.example.com {
    encode gzip zstd
    tracing {
        span caddy_prometheus
    }
    reverse_proxy prometheus:9090
}

grafana.example.com {
    encode gzip zstd
    tracing {
        span caddy_grafana
    }
    reverse_proxy grafana:3000
}

jaeger.example.com {
    encode gzip zstd
    tracing {
        span caddy_jaeger
    }
    reverse_proxy jaeger:16686
}
Please go to Caddy Post to get more insight to deploy it in the docker swarm cluster.
Here I used a custom Caddy docker container with plugins, like Cloudflare DNS, Caddy Auth Portal etc…
Please find the custom caddy docker image below.
Observability Stack Configuration Files
We need couple of configuration files before deploying our Observability Stack.
One of the important configurations file is OpenTelemetry Configuration, otelconfig.yaml
Create configuration file using below command
sudo nano otelconfig.yaml
Copy and paste the below code into the file
receivers:
  loki:
    protocols:
      http:
    use_incoming_timestamp: true

  otlp:
    protocols:
      grpc:
      http:

processors:
  batch:

  attributes:
    actions:
      - action: insert
        key: loki.attribute.labels
        value: container
      - action: insert
        key: loki.format
        value: json

exporters:
  loki:
    endpoint: http://loki:3100/loki/api/v1/push

  otlp/quickwit:
    endpoint: quickwit:7281
    tls:
      insecure: true

  prometheus:
    endpoint: "0.0.0.0:8889"

service:
  pipelines:
    logs:
      receivers: [loki]
      processors: [attributes]
      exporters: [loki]
    traces:
      receivers: [otlp]
      processors: [batch]
      exporters: [otlp/quickwit]
Promtail Configuration File, promtail-local-config.yaml
Create configuration file using below command
sudo nano promtail-local-config.yaml
Copy and paste the below code into the file
server:
  http_listen_port: 9080
  grpc_listen_port: 0

positions:
  filename: /tmp/positions.yaml

clients:
  - url: http://otelcol:3500/loki/api/v1/push

scrape_configs:
  - job_name: flog_scrape
    docker_sd_configs:
      - host: unix:///var/run/docker.sock
        refresh_interval: 5s
    relabel_configs:
      - source_labels: ['__meta_docker_container_name']
        regex: '/(.*)'
        target_label: 'container'
Prometheus Configuration File, prometheus.yml
Create configuration file using below command
Copy and paste the below code into the file
sudo nano prometheus.yml
global:
  scrape_interval:     15s
  evaluation_interval: 15s

scrape_configs:
  - job_name: 'opentelemetry-collector'
    static_configs:
      - targets: ["otelcol:8888"]

  - job_name: 'prometheus'
    static_configs:
      - targets: ['prometheus:9090']

  - job_name: 'caddy'
    static_configs:
      - targets: ['caddy:2019']
Deploy Observability Stack using Docker Compose
Now it’s time to deploy our docker-compose file above docker-compose.yml using the below command
sudo docker compose up -d
Check the status of the each service using docker ps
Access Applications
Make sure that you have DNS entry for each application configured in your DNS Management Application.
Like jaeger.example.com, grafana.example.com and prometheus.example.com
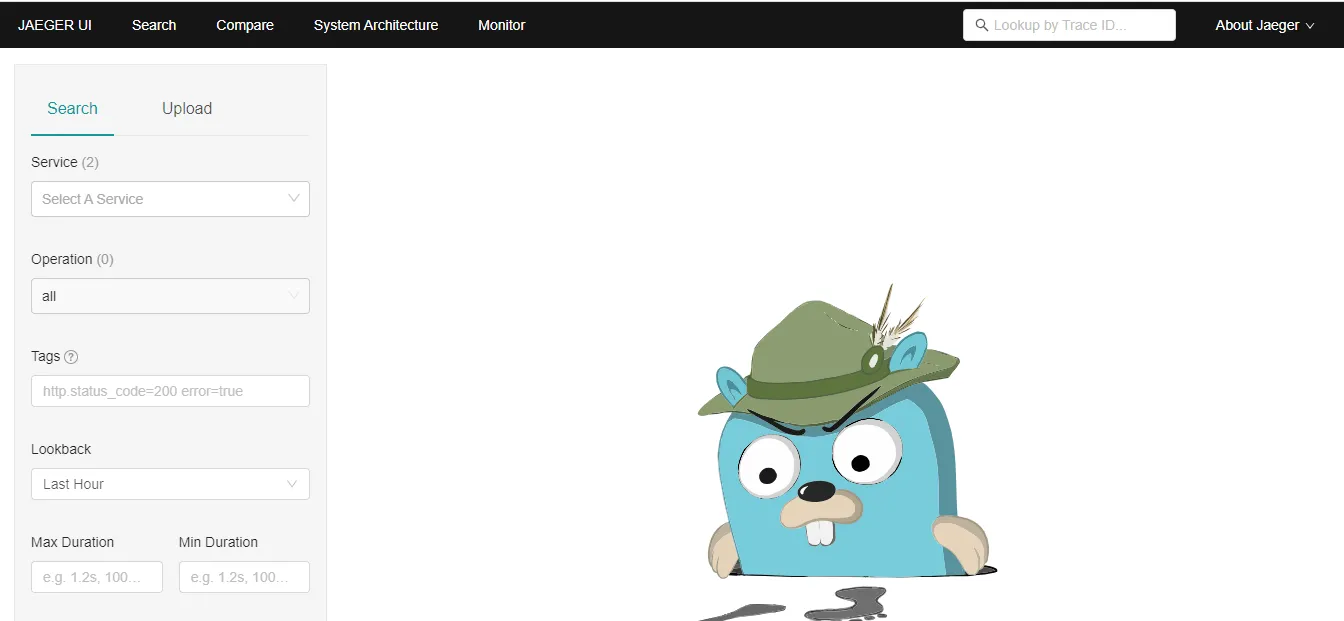
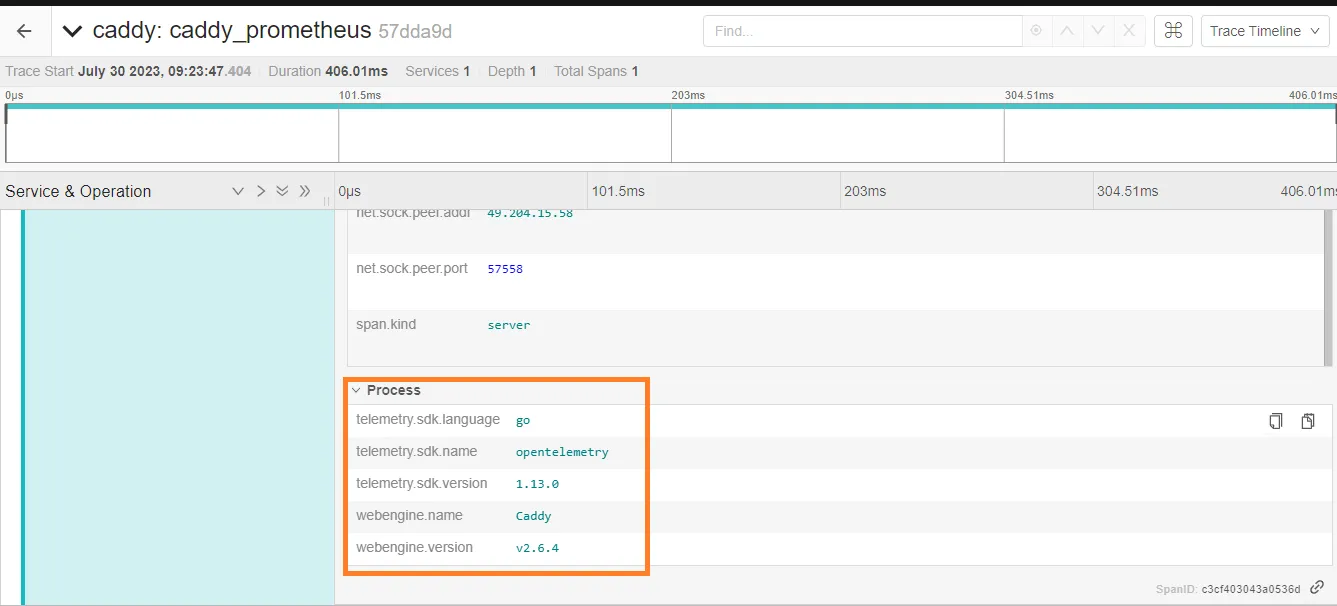
Please find below Jaeger images for your reference.


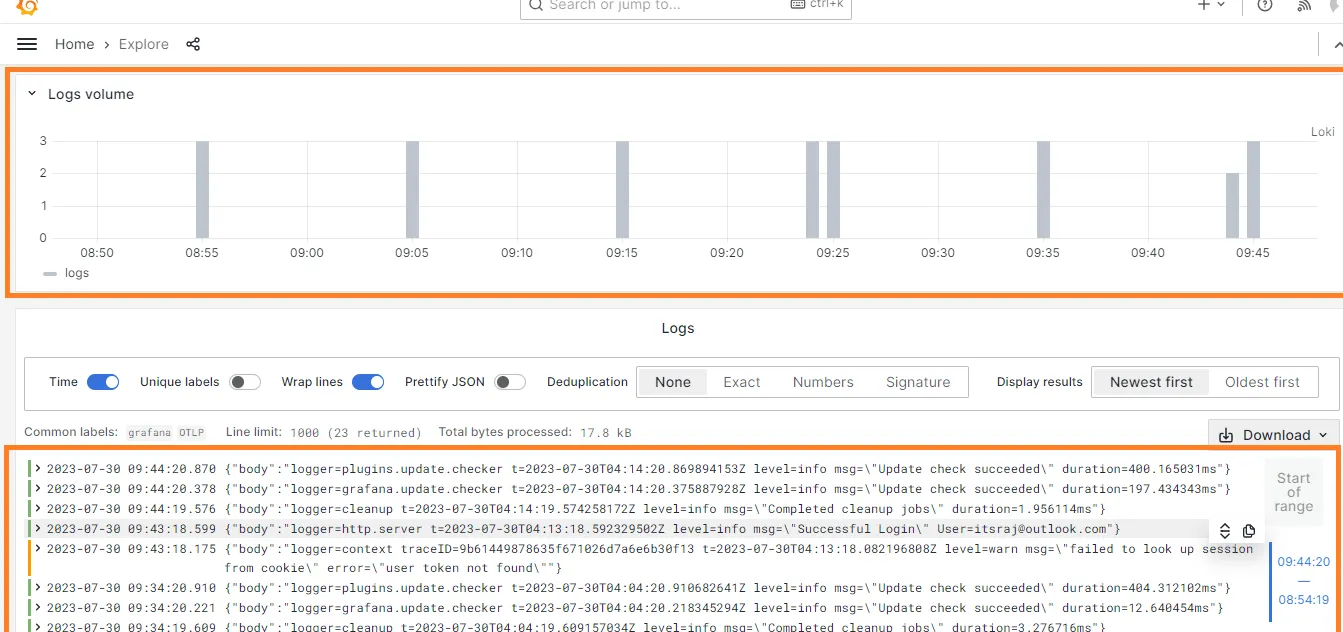
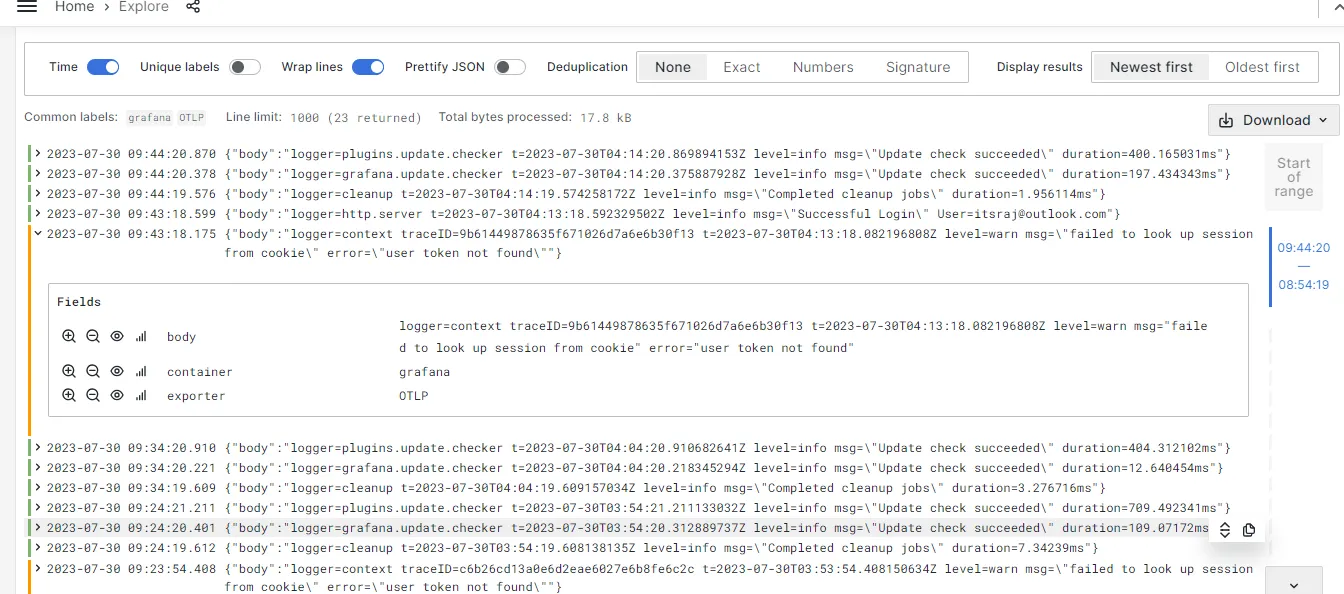
Please find below Grafana images for your reference.


Please find below Prometheus images for your reference.


Hope you enjoyed this tutorial, please give your input/thought on it by commenting below. It would help me to bring more articles that focus on Open Source to self-host.
Stay tuned for other deployments in coming posts… 🙄